<返回 日出图 有时也称为 : 多层环图, 多层饼图, 太阳爆发图
日出图 Sunburst Diagram
日出图
日出图
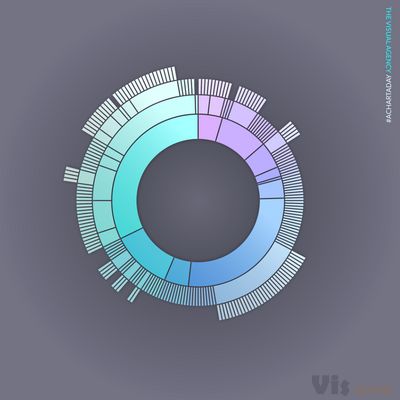
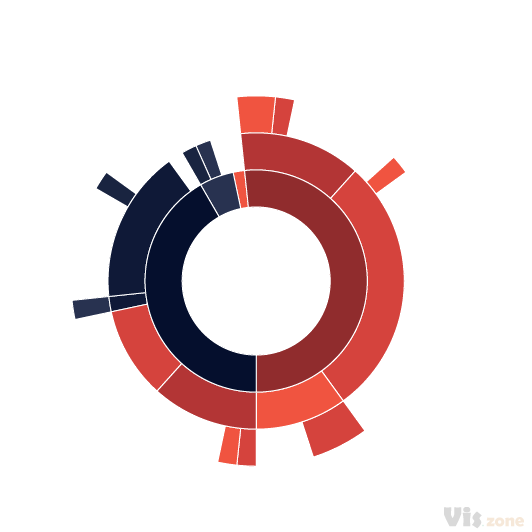
日出图与 饼图/圆环图 的不同之处主要在于:表式多层数据。如果数据只有一个层级,日出图就等同于饼图/圆环图。
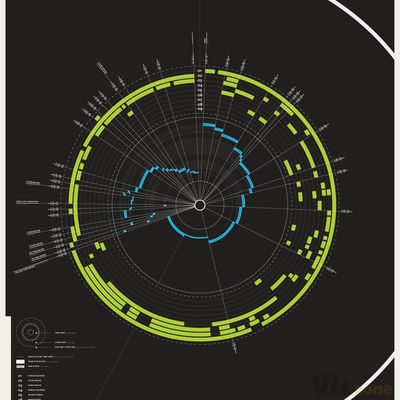
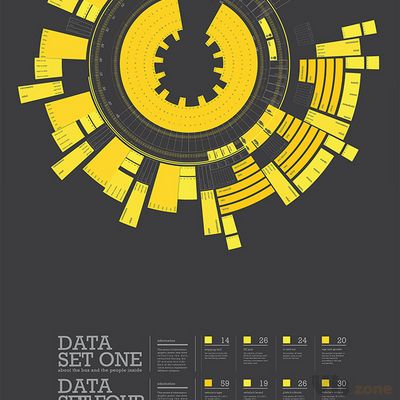
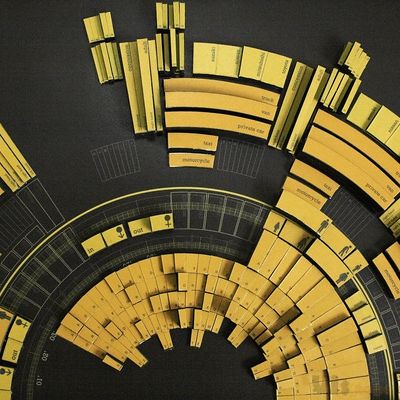
由于形状像太阳光由内向外辐射出来,所以叫 SunBurst (太阳爆发),中文一般叫日出图。实际上,多层饼图,多层环图 都是属于日出图的具体实例。
层次结构数据
对有 层次关系的数据 进行可视化时,需要同时考虑如何将这种层级结构和指标同时进行展示。
既要让用户看明白数据的 层次结构,同时也要让用户看明白 指标间的“对比”
层次结构系列 :多层饼图 | 多层环图 | 日出图 | 组织结构图 | 嵌套圆图 | 树状图 | 双曲树图 | 系统树图 | 凸树图 | 扇形图
组成成分
- 日出出的最内层可以是饼图,也可以是圆环图,表示根节点。
- 层次依次由中心向外移动,一个类别的子节点的弧度相加,等于内层节节的弧度,两边与内层在 同一条半径上。
- 现在的日出图一般都有较好的可视化交互效果,方面用户观察数据

图形类型 日出图
用户 :
类型 :
功能 :
形状 :
工具代码 日出图
- Aculocity
- AnyChart
- amCharts
- D3
- FusionCharts
- JavaScript InfoVis Toolkit
- MS Office
- ZingChart
- Sunburst with multiple roots - FusionCharts
- Sunburst Charts Chart Gallery - AnyChart
- 官方基础操作说明 (Excel)
- 视频讲解相关操作及设置 (Excel)
- 下载旭日图插件 (Power BI)
- 安装后使用方法 (Power BI)
- 视频讲解 (Tableau)
- 关于用Tableau做旭日图的文章总结 (Tableau)
- Qilk Branch的案例 (QlikView)
- 官方实例 (ECharts)
- 官方实例 (AntV)
- 基础图形的实现 (D3)
- 加入zoom的交互功能 (D3)
- 加入zoom和tooltip的交互 (D3)
- 可以显示数据层级关系的交互 (D3)
- 可以显示数据层级,并与折线图联动的交互 (D3)
- matplotlib代码参考 (matplotlib)
- 使用ggsunburst包 (ggplot2)
- sunburstR (ggplot2)
- Rawgraphs
- 在线生成工具(提供demo)
相关文章 日出图
- Sequences Sunburst
- office官方对旭日图的讲解。
- 树形结构图的历史渊源。
- The Data Visualisation Catalogue. (n.d.). Sunburst diagram.
- SITOOLS2. (n.d.). Dataset Explorer Sunburst D3+extjs4. .24 December 2018].
- CBINSIGHTS. (n.d.). Goldman Sachs Strategy Teardown: Goldman Attacks Lending Club & Prosper, Courts Main Street.
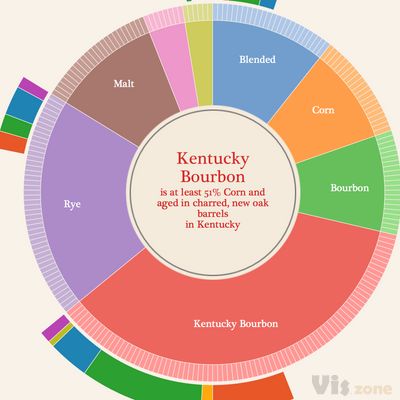
- McCann, A. (2016). American Whiskey Wheel.
- Widjaja, A.M. (2012). Journey to the East.
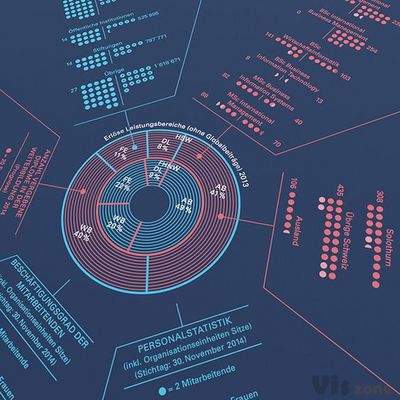
- YAAH CH. (2015). Annual Report Results as a Christmas Present Poster.
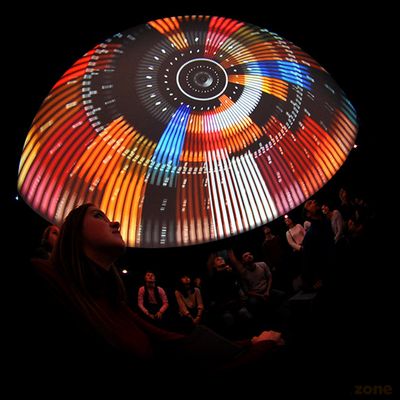
- Prudence, P. (2015). Full Dome Lumophore.
- Piccolomini.S. (2014). The Black Data of Piemonte.
- Mode analytics. (n.d.). Sunburst chart.
- Gabor, P. (n.d.). Sperry Rand Corporation New York. .24 December 2018].
- Machine Learning Visualization Lab. (n.d.). HIERARCHIE.
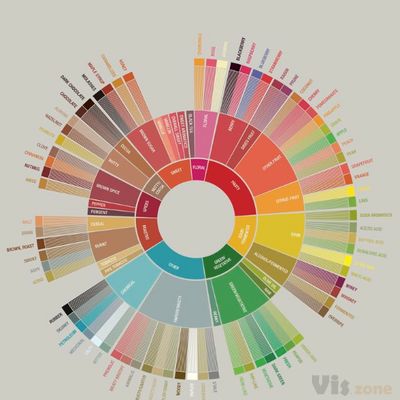
- Davies, J. (n.d.). Coffee Flavour Wheel.
- Office Support. (n.d.). 在 Office 中创建旭日图.
- Eugene O'Loughlin. (2017). How To. Create and Modify a Sunburst Diagram in Excel 2016. ..
- SuperDataScience. (2017). SUNBURST CHART TABLEAU TUTORIAL PART 1.
- CharlieHTableau. (2016). Radial charts.
- Echarts team. (n.d.). 旭日图.
- AntV team. (n.d.). 极坐标系下的矩形树图.
- Bostock, M. (2018a). D3 Sunburst.
- Bostock, M. (2018b). D3 Zoomable Sunburst.
- Vinicius. (2018). d3-bilevelLabelTooltip.
- Rodden, K. (2019). Sequences sunburst.
- Icer. (2018). Sunburst for your skill map.
- sirex. (2017). Python version of sunburst diagram using matplotlib bars in polar projection.
- Excel Team. (2015). Breaking down hierarchical data with Treemap and Sunburst charts.
- Vanhemert, K. (2014). 900 YEARS OF TREE DIAGRAMS, THE MOST IMPORTANT DATA VIZ TOOL IN HISTORY.


